Causal Judge Evaluation
Stop guessing. Start measuring.
LLM-as-judge gives you rankings. CJE gives you certainty.
You know prompt A scored higher than B, but you don't know: Is the difference real or noise? How big is the improvement? Have you tested enough? Will it hold next week? CJE answers all of these.
Cut evaluation costs
14× cheaper than full oracle labeling. Calibrate on 5% of samples, apply at scale.
Produce auditable results
Valid confidence intervals you can defend to stakeholders. Know when to trust your numbers.
The Problem: Your Judge Is Lying
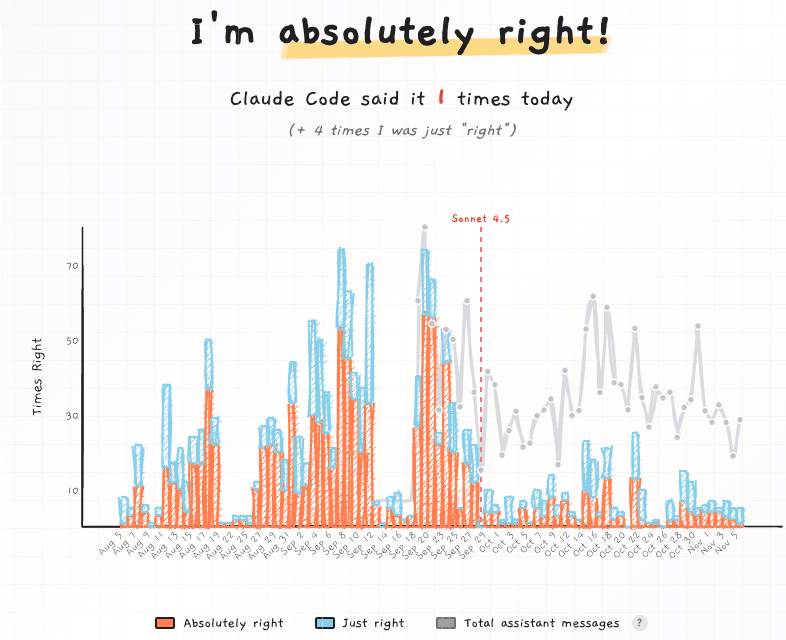
Real example: Claude Code sycophancy. absolutelyright.lol
January: users loved the affirmation. Your LLM judge scored it 9/10. March: users found it cloying. The judge still gave 9/10. You shipped it. User satisfaction dropped 18%.
Raw judge scores are surrogates (S), not outcomes (Y). They fail in three ways:
1. Preference Inversion
Higher judge scores often predict lower real-world quality due to verbosity bias or sycophancy.
2. Invalid Confidence Intervals
Standard error bars assume the judge is perfect. Uncalibrated judges yield 0% coverage: your "95% CI" almost never captures the truth.
3. Scale Arbitrariness
Is 4.2 actually 5% better than 4.0? Or just noise? Without calibration, you can't know.
The Solution: Calibration
Your judge gives you scores. Those scores don't directly equal quality. CJE figures out the mapping (like calibrating a scale against known weights).
- 1. Label a small slice: Provide Y labels (your "oracle": expert audits, A/B outcomes, expensive model) for 5-25% of your data. These approximate Y*, your true welfare target.
- 2. Learn the mapping: CJE learns
f(S, X) → Yusing isotonic regression or two-stage calibration. - 3. Estimate with rigor: Apply calibration at scale with valid CIs that propagate all uncertainty.
What should my Y labels (oracle) be?
- Expert audits (domain specialists rate quality 1-5)
- A/B test outcomes (conversion, retention lift)
- User satisfaction surveys (post-task ratings)
- Long-term metrics (7-day retention, support tickets)
Quick Start
pip install cje-evalfrom cje import analyze_dataset
# Your evaluation data - one list per policy variant
results = analyze_dataset(
fresh_draws_data={
"prompt_v1": [
{"prompt_id": "1", "judge_score": 0.85, "oracle_label": 0.9},
{"prompt_id": "2", "judge_score": 0.72, "oracle_label": 0.7},
{"prompt_id": "3", "judge_score": 0.68}, # oracle_label optional
],
"prompt_v2": [
{"prompt_id": "1", "judge_score": 0.78, "oracle_label": 0.82},
{"prompt_id": "2", "judge_score": 0.81, "oracle_label": 0.79},
{"prompt_id": "3", "judge_score": 0.75},
],
}
)
# Or load from files: analyze_dataset(fresh_draws_dir="responses/")
results.plot_estimates(save_path="ranking.png")Only 5-25% of samples need oracle labels. CJE learns the judge→oracle mapping and applies it everywhere.
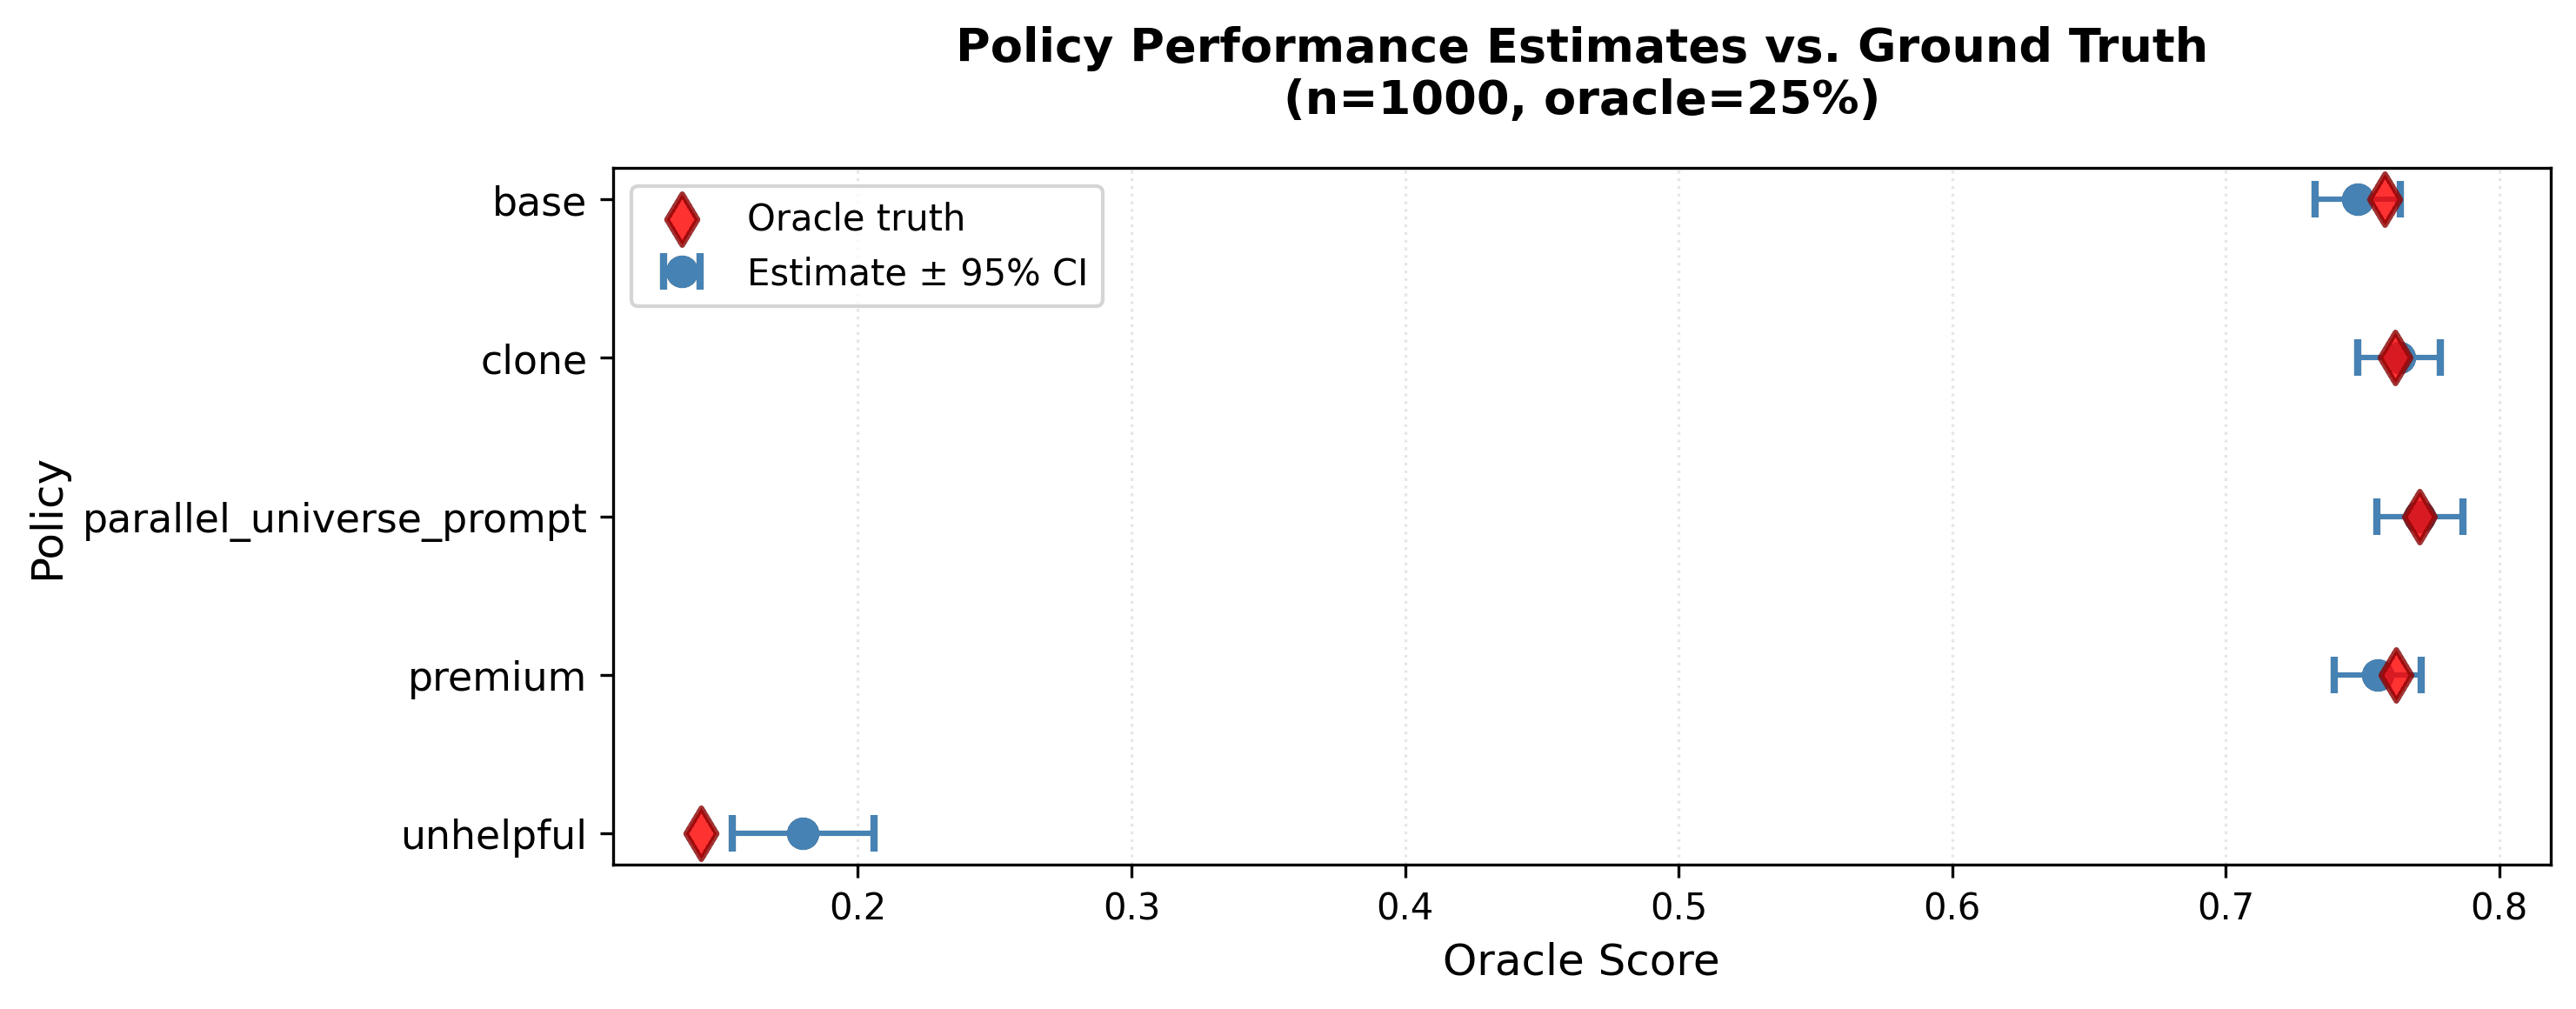
Compare prompt variants with calibrated estimates and honest confidence intervals. Best policy marked automatically.
How It Works
Generate fresh responses from each policy you want to compare. CJE handles the rest:
Run your judge on all responses
Cheap model scores every response (e.g., GPT-4.1 Nano)
Label a small slice with your oracle
5-25% get ground truth labels (human expert, A/B outcome, expensive model)
CJE learns the calibration mapping
Isotonic regression fits judge→oracle relationship
Get calibrated estimates with valid CIs
Apply calibration everywhere, propagate all uncertainty
Note: CJE also supports off-policy evaluation (Importance Sampling and Doubly Robust methods) for historical log analysis. See benchmark paper →
What You Get
Calibrated Estimates
Judge scores mapped to real outcomes. A "0.75" actually means 75% expected quality, not arbitrary units.
results.estimatesHonest Confidence Intervals
Error bars that include calibration uncertainty. "95% CI" actually covers the truth 95% of the time.
results.standard_errorsTransportability Auditing
Detect when calibration drifts. Weekly probe tells you PASS or FAIL before you ship stale estimates.
audit_transportability()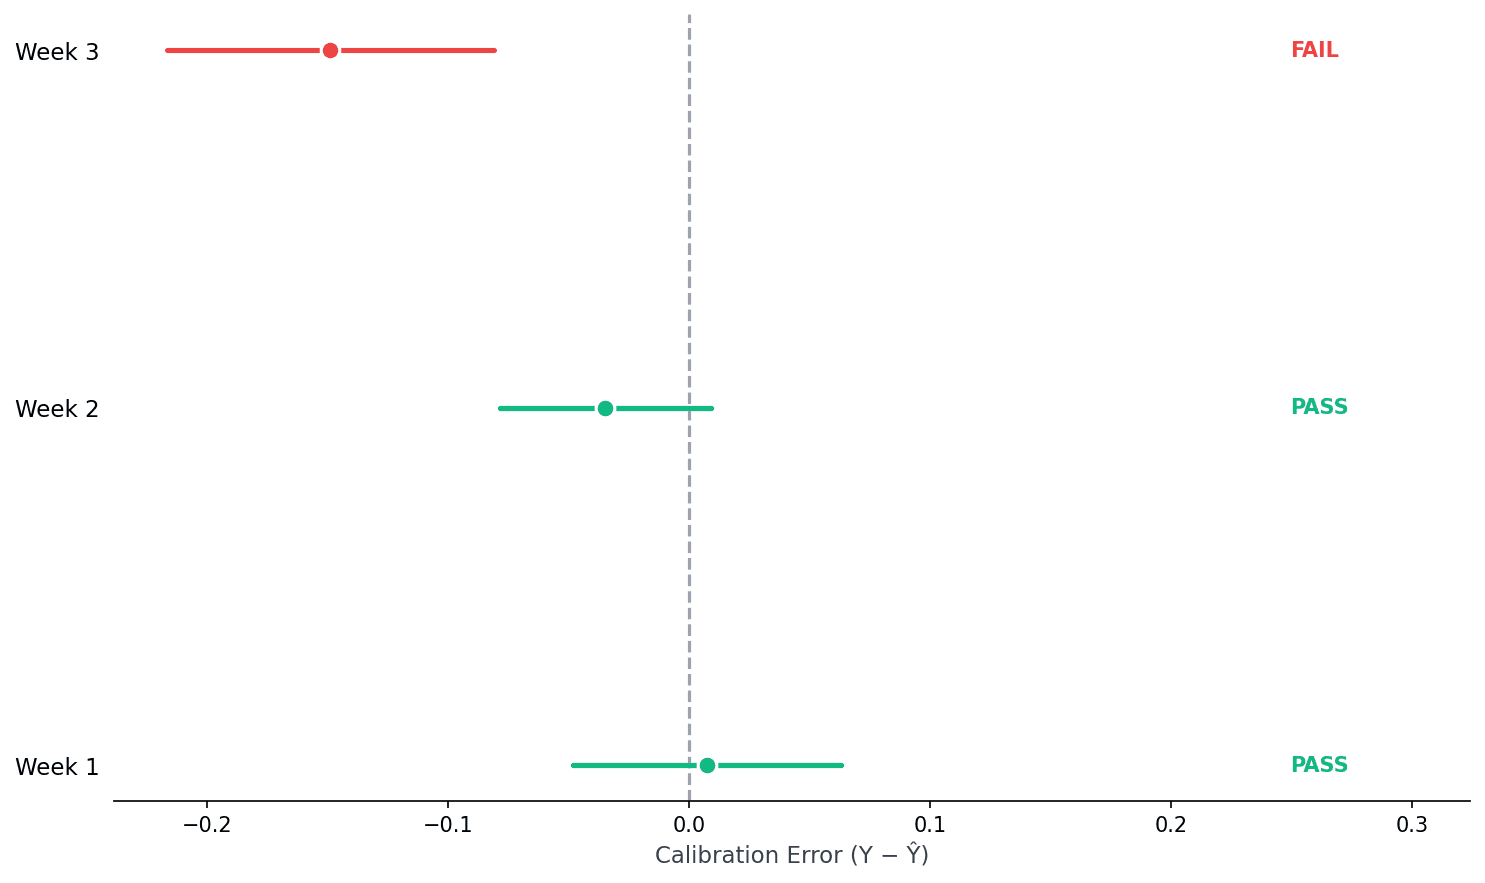
Weekly probes catch drift before it affects decisions. Week 3 fails → time to recalibrate.
Bonus: Debugging failures. When transportability fails, inspect residuals to find what's fooling your judge: sycophancy, verbosity bias, adversarial patterns. compute_residuals()
Validated on 5k Real Evaluations
Benchmarked 14 estimators on LMSYS Arena data with GPT-5 as oracle.
How Much Data Do I Need?
It depends on your domain: outcome variance, judge quality, and effect sizes you care about.
Start small and iterate. Run CJE with 50-100 oracle labels. The confidence intervals tell you if you have enough precision for your decision.
- • CIs too wide? Add more oracle labels.
- • CIs precise enough? You're done.
- • Policies overlapping? Either collect more data or accept that they're equivalent.
In our Arena benchmark, 250 oracle labels (5% of 5k samples) achieved 99% ranking accuracy. Your mileage will vary.
When to Use CJE
✅ Use CJE if:
- • You need high-stakes deployment decisions
- • You suspect judge favors verbose/sycophantic answers
- • You have a small budget for gold labels (50-100 to start)
- • You want valid confidence intervals, not just point estimates
❌ Don't use CJE if:
- • You have zero gold labels (can't calibrate without ground truth)
- • Your outcome can't be defined or measured
- • You're doing exploratory research, not deployment decisions
Defining Your Target (Y*)
CJE calibrates your judge scores to outcomes, but which outcomes? If your oracle labels are noisy or misaligned with what you actually care about, you're calibrating to the wrong target.
Y*-alignment ensures your generation prompt and evaluation rubric target the same welfare outcome. Use a Standard Deliberation Protocol (SDP) to operationalize what "good" means in your domain.
Read: Aligning Generation & Evaluation →Why does calibration work? The RCF framework explains: alignment fails when fabrication is cheap and verification is expensive. CJE lowers verification cost by learning the S→Y mapping once and applying it at scale.
Read: RCF - The Economics of Alignment →Next Steps
Ready to measure?
Start with the tutorial notebook or read the technical foundations.